
One product · in development
Stradion is building Oikos.
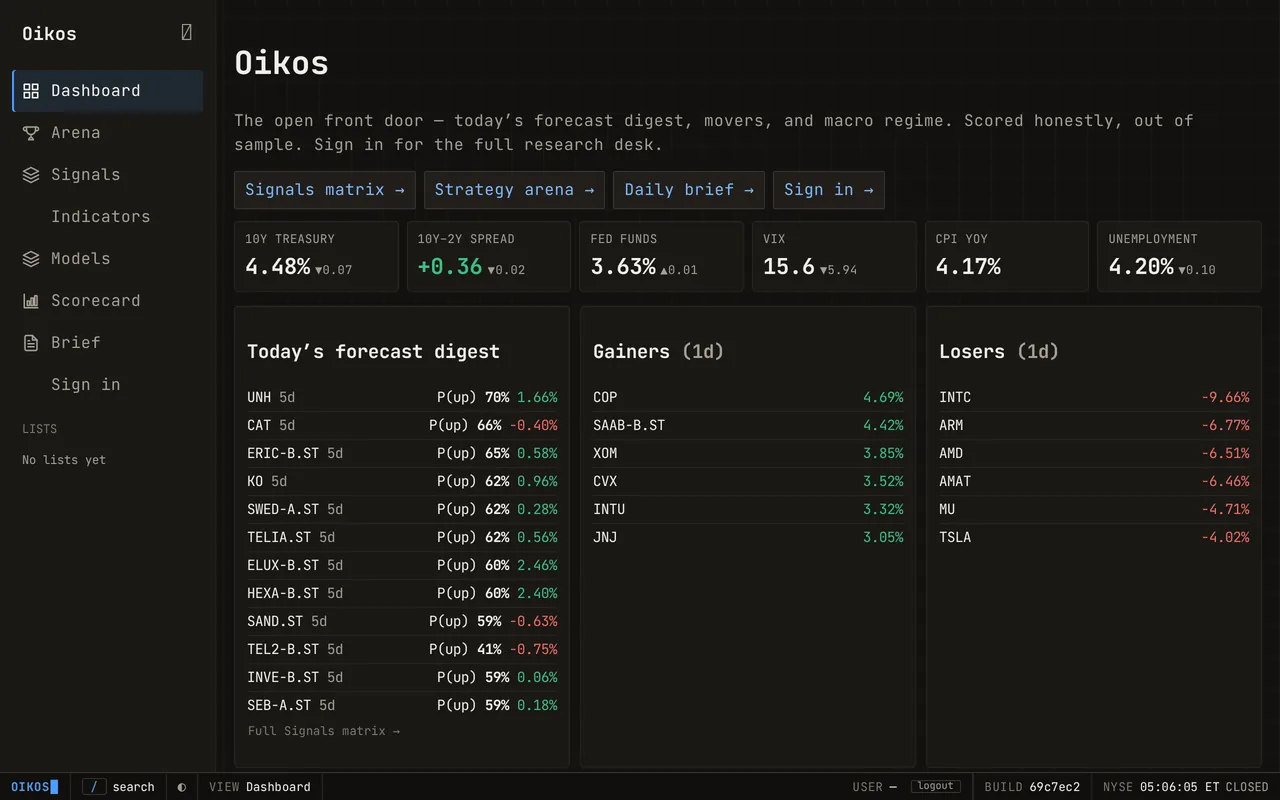
Oikos is a quantitative research terminal for self-directed investors — probabilistic forecasts scored out of sample, a strategy arena, a daily news brief, and a full research desk in one place. A public preview is open now — the forecast digest, Signals matrix, strategy Arena, and daily Brief — with the full research desk by invitation.
oikos.stradion.com/#/
Statusresearch only · not investment advice
Built in the open, scored honestly.
Every forecast Oikos publishes is graded after its window closes, on the data the model could have used at the time — misses included. The terminal is evolving quickly; if you'd like an early look, ask for an invitation.